Condition monitoring, i.e. preventive maintenance, has become indispensable in many areas. For example, the change intervals of engine oils in block-type thermal power stations can be optimized, hydraulic systems can be protected from standstills or transformers can be monitored for their operational safety. The areas of application are therefore not only widely spread in industry but also serve a wide variety of purposes.
The mode of operation is mostly identical. Oil samples are carefully taken on site by trained personnel and sent to the laboratory by post. A large number of physical and chemical properties are examined there and a diagnosis is made on the basis of the results. The assessment is carried out by qualified personnel taking into account all information from the laboratory and the machine, such as service time, last maintenance or oil change. Recommendations for use can then be derived from the overall findings.
As part of the Industry 4.0 initiative, which deals with the digital networking of intelligent systems, Oil Condition Monitoring also raises the question of what preventive maintenance of the future might look like. The obvious idea is to use physical and chemical sensors to monitor the condition of lubricants in real time. In the field of physical data acquisition, such as structure-borne noise (vibrations), viscosity or temperature, technical solutions are quickly found, but the monitoring of chemical characteristics is much more difficult. The laboratory methods used to date for making reliable diagnoses are mostly based on expensive testing methods. For example, abrasion is investigated using optical emission spectroscopy (OES) or energy dispersive X-ray fluorescence (EDX) by detecting the element concentration of iron. It is not easy to find cost-effective alternatives for online sensors here, especially under the prerequisite of equivalent detection methods. The same applies, for example, to pH electrodes, which are quickly occupied by dirt particles in the field and can only be used to a limited extent.
Consequently, new methods are required for reliable online diagnostics. A glance at the field of gas sensor technology shows that electrochemical characterization processes can be implemented cost-effectively as sensors. Here, chemoselective electrochemical cells are often built up, which generate signals in the form of an electrical voltage when a gas is detected. However, gas sensor technologies are not directly transferable to lubricants and the sensor technology only recently developed accordingly.
Irrespective of whether signals are recorded with sensors or characteristic values are to be measured in the laboratory, the findings must then be subjected to a diagnosis. A comparison of individual characteristics with limit violations is often not sufficient, but a holistic view provides information about necessary measures.
Exactly at this point, i.e. the evaluation of patterns and the dependence of different characteristics, artificial neural networks (ANN) help to recognize correlations. Like the engineer, the system continuously learns to recognize problems from case studies and to assess their severity.
The question arises as to how complex such an ANN must be in order to be able to reliably make diagnoses? To give you as an interested reader an idea, I would like to present an implementation in Microsoft Excel. You can simply conduct the training yourself and create studies, the corresponding source code can be downloaded at the end of this article.
In principle, ANN are composed of an Input Layer (IL) for capturing the input signals, one or more Hidden Layers (HL) for signal interpretation and the Output Layer (OL) for displaying the results. In the simplest case, the output layer generates only a single result.
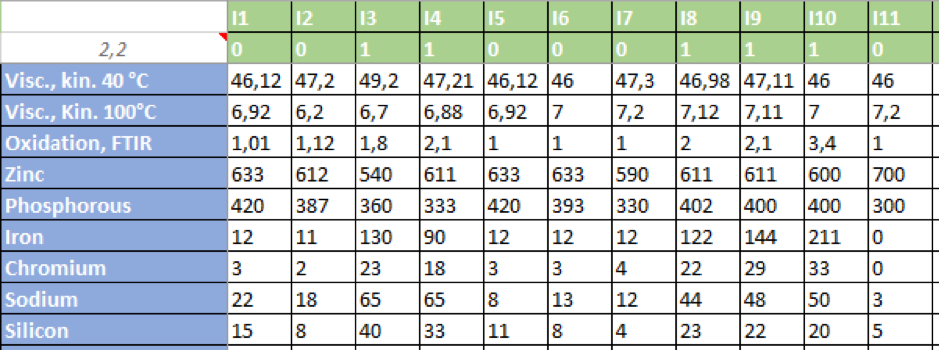
Imagine we want to examine a lubricant, e.g. a hydraulic oil, in the context of an Oil Condition Monitoring and record a total of nine characteristics: Viscosity 40°C and 100°C, oxidation, zinc, phosphorus, iron, chromium, sodium and silicone content. We receive information on usability (viscosity and additive elements phosphorus and sulphur), abrasion (wear elements iron, chromium) and impurities (sodium, silicone). The IL must therefore process a total of nine input signals, which transmit the measurement data to the HL for analysis.
The aim of the case study is to train the ANN to recognize samples with high wear characteristics. For this purpose, a percentage probability value is to provide a measure of the characteristic. Consequently, the OL has a single result value.

The table above contains the course data. In the green cells the data records are numbered (I1-I11) in the first row, in the second row the data records with wear are marked with the number 1, those without findings are marked with 0. The characteristics are named in blue. The factor 2.2 represents the ratio of undetected and data records with findings and serves the ANN for balancing. The trained observer immediately recognizes that data sets marked with 1 have increased iron and chromium contents as well as sodium and silicon.
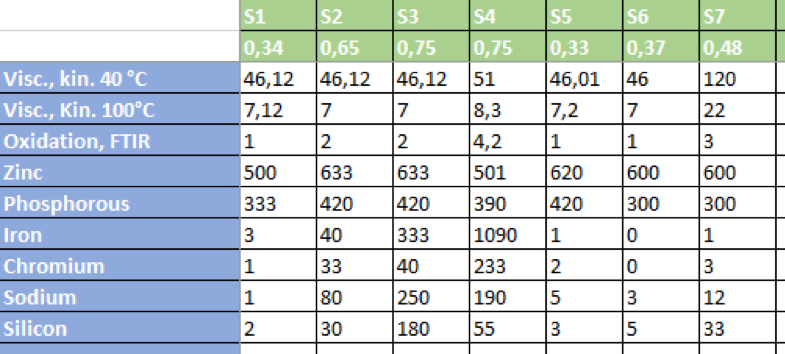
After the ANN has been trained with the data sets, unknown samples can then be examined for conspicuous contamination. The table below shows an exemplary diagnosis and can be found in the Excel file in the AL tab.

In the green cells the samples are numbered in the first row (S1-S10). The second line contains the probabilities of contamination determined by the ANN. It can be seen directly that samples with markedly high iron and chromium contents or sodium and silicon values have output signals of 0.75, i.e. a significantly higher probability of wear.
After already eleven training sets it is therefore possible to find targets in unknown data sets. At this point I would like to invite you to do your own training and to improve the hit rate. Theoretically values of only 1 and 0 are achievable, depending on the number and quality of the training data sets.
Even with this trivial approach, the potential is immediately recognizable and clearly shows how eye-catching samples can be easily identified by simple training. In this case, there are hardly any limits to the imagination and, for example, different ANNs can be trained for certain findings. For example, one can detect wear as in this example, whereas others are trained for oxidative changes. The coupling can ultimately cover a complete diagnostic report.
Technically, however, limits can also be named, because training data is required for every problem. These must be selected and diagnosed by humans in advance in order to be able to train the ANN. Accordingly, a considerable amount of training is necessary. But as we all know, a diagnostician for lubricants has never fallen from the sky. This is also an important reason why only very experienced employees are working in these jobs. The advantage of a trained ANN is in any case that it is easy to copy.
To further explore the potentials of Machine Learning we offer a very easy to use solution based on Microsoft Excel, which can be downloaded here.
